Environmental history recorded in aeolian deposits under stone pavements, Mojave Desert, USA
Abstract
Reconstructing the evolution of arid landscapes is challenged by limited availability of appropriate environmental archives. A wide-spread surface feature – stone pavement – traps aeolian fines and forms a special accretionary archive. Seven stone pavement-covered sections on basalt flows in the eastern Mojave Desert are condensed to a composite section, comprising five sedimentological units, supported by an OSL-based chronology. Three of the units are of accretionary nature and each is covered by a stone pavement. They were deposited 50.9-36.6 ka, 36.6-14.2 ka and 14.2 ka and are intimately coupled with the history of nearby Lake Mojave, which advances the current picture of regional aeolian activity. End-member modelling analysis of grain-size distributions yielded seven sediment transport regimes. The accretionary system operates in two modes: A) episodic formation of a stone pavement by lateral processes once a vesicular horizon has formed on a barren surface and B) accretion of dust and eventually burial of the clast layer. These findings improve current concepts about stone pavement evolution and their environmental proxy function in arid landscapes. Stone pavement-covered accretionary deposits are a new key archive that allows quantifying the relative importance of dust accretion, slope processes, soil formation and vegetation cover.
keywords:
Quaternary; OSL dating; grain-size end-member modelling; EMMA; eastern Mojave Desert[cor1]corresponding author
1 Introduction
The evolutionary history of a landscape is typically investigated by analysing proxy data of sedimentary archives. Closed terminal lake basins, which hosted water bodies during pluvial periods (eg., Reheis et al., 2012; Francus,P. et al., 2013; M. et al., 2013) are the most widely used type of archive but may have suffered from desiccation and interrupted deposition, reworking or even erosion of previously deposited material.
Accordingly, other archives need to be utilised. Aeolian sand deposits allow reconstructing phases of aeolian activity versus environmental stability, and they can also give information about palaeo-wind directions (eg., Lancaster,N., 2007). However, they usually cover only narrow time windows, suffer from truncation and reworking during new activity periods and can sometimes be ambiguous to interpret in terms of type and timing of constructing processes (D. et al., 2012). Specific components of the environmental history have been retrieved from special archives, such as rock varnish micro-laminations (eg., Liu,T., 2003; Liu,T. and S., 2007), packrat-midden remains (A. et al., 2005a), calcium carbonate formations (J. et al., 2006) and soil-sediment successions (von Suchodoletz,H. et al., 2009). However, most of these archive types also can be discontinuous, cover only small time windows or are prone to reworking and erosion.
Accretionary soil-sediment systems may contain hiatuses to a lesser degree. A special type of accretionary soil development (D., 2013) is related to a prominent surface type in arid environments around the globe: stone pavements (eg., Cooke et al., 1993). These are surficial armours of lightly to extensively varnish-coated clasts, which may be loosely to tightly packed. Stone pavements are widespread on various landforms, covering as much as 50 % of the arid landscape (eg., Evenari et al., 1985; S., 1986). Stone pavements are underlain by several decimetres to a few metres of virtually stone-free aeolian dust (G. et al., 1985). The rough stony surface is effective in trapping aeolian material. Thus, below the pavement and within the accretionary mantle a fine-grained horizon evolves, which exhibits a prominent vesicular and platy structure, the vesicular or Av horizon. Its vesicles consist of rounded, isolated pores up to a few millimetres in diameter. Freshly trapped aeolian material is incorporated into the Av horizon by translocation along boundary cracks and macropores to ped interiours. The Av horizon experiences volumetric changes through shrinking and swelling, which in terms help to maintain the clasts at the surface (D. et al., 1986, 1998; Anderson et al., 2002). These co-genetic processes of accretionary aeolian mantle deposition, pavement formation, and soil formation act together and yield a vertical sequence that thickens over time. Thus, such deposits may be valuable environmental archives because of their broad geographic occurrence, their ability to record periods of dust deposition and their resistance to erosional modification.
Stone pavement-covered accretionary deposits on basalt flows, alluvial fans and palaeo-shore lines in many deserts have already been extensively investigated in terms of relative age indicator (eg., Dan et al., 1982; D., 1988; D. et al., 1998; Dunkerley, 1995; Al-Farraj,A. and M., 2000). With time the degree of soil development increases, expressed for example by increasing values of the profile development index (W. et al., 1991) or increasing secondary carbonate contents and carbonate morphology stages. However, soil development can also vary remarkably on landforms of the same age within a few tens of metres, as demonstrated by A. et al. (2002, 2005b), who highlighted the close relationship between surface properties (pavement coverage, clast size, vegetation density and type) and subsurface properties. Dietze et al. (2011) also found remarkable soil heterogeneity, though under nearly identical surface properties. Such heterogeneity argues for a sensitivity of such accretionary deposits to changes in environmental forcing mechanisms – a prerequisite to use stone pavement-covered sediments as environmental archive – and demands a more systematic investigation of the heterogeneous properties.
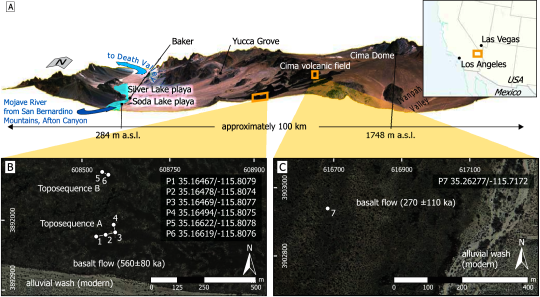
Although accretionary deposits under stone pavements are a global phenomenon, these features and the conditions under which they evolve have perhaps been investigated most extensively in the eastern Mojave Desert, California, USA. Thus, this region is well-suited to explore the potential of such accretionary systems as environmental archives. The landscapes of the Mojave Desert are located in a climatically highly transient area and experienced significant environmental changes during the transition from the Pleistocene to the Holocene, including the transition of a lake to a playa environment, and several aeolian activity phases and shifts in vegetation communities with elevation (eg., Lancaster,N. and P., 2003; V. et al., 2003; G. et al., 2003; L. and McDonald,E., 2013). The region contains a productive dust source (the Soda Lake playa, fed by the Mojave River; Figure 1 A) and a topographically distinct suite of relatively unmodified to dissected basaltic lava flows (i.e. Cima volcanic field) that are downwind from the dust sources and display increasing degrees of stone pavement development on progressively older flows. The palaeohydrology of Soda Lake playa and Silver Lake playa (i.e. Lake Mojave in pluvial times) as well as their interfingering with alluvial fan deposits has been extensively studied (G. et al., 2003). Formation ages, surface properties and aeolian mantle evolution histories of the basalt flows of Cima volcanic field are also well constrained (G. et al., 1985; D. et al., 1986). D. et al. (1986) developed a conceptual model of soil development stages from numerous metre-thick soil-sediment-successions formed on lava flows as old as 1.1 Ma and thereby highlighted the importance of admixture of aeolian fines and climate-related pedogenetic alteration. However, depositional ages of the aeolian sediments forming the accretionary mantles are unknown so far (apart from an estimate for the Av horizon, (D. et al., 1998; Anderson et al., 2002), which limits a connection of these deposits with the hydrological history of Lake Mojave and aeolian activity phases throughout the eastern Mojave Desert (V. et al., 2003).
This paper demonstrates the potential of a widely occurring feature of arid environments – stone-pavement covered accretionary systems – as environmental archives, based on a regional example in the Mojave Desert. A series of accretionary soil-sediment sections on two basalt flows of Pleistocene age are used to construct a composite section comprised of five distinct sedimentological units. Descriptive and quantitative proxies of geomorphologic process activity and related environmental conditions are evaluated. Supported by an OSL-based chronology, the evolutionary history of the accretionary soil-sediment complexes is reconstructed and put into context with existing information from other palaeo-environmental studies from the eastern Mojave Desert to create a more comprehensive picture of process interconnections related to environmental change.
2 Study area
The Quaternary landscape evolution in the eastern Mojave Desert is intimately linked with the evolution of the Mojave River drainage system, which successively prograded downstream by filling basins and overspilling them (Enzel et al., 2003; C. and L., 2008). During the Quaternary, this stream fed at least four lake basins progressively downstream. Lake Mojave, the most important one for this study area, covered the present Soda Lake and Silver Lake playas. The lake formed by the overspill of the large upstream Lake Manix at or near the current location of Afton Canyon and subsequent channel downcutting around 25 cal ka BP (G. et al., 2003) (for the sake of consistency radiocarbon ages were recalibrated with OxCal 4.2 and IntCal13) (Bronk Ramsey, 2009; J. et al., 2013). However, Lake Manix overflowed several times prior to this downcutting period (OIS 4 and/or OIS 6) and probably fed a small perennial lake or marsh at the southern end of Soda Lake playa (C. and L., 2008). G. et al. (2003) presented a detailed history of the later Lake Mojave based on radiocarbon dates on bulk samples and shells. Initial (25 cal ka BP) and varying (23.5 cal ka BP) conditions led to two stable lake phases (20.5 cal ka BP to 18.1 cal ka BP and 14.5 cal ka BP to 11.3 cal ka BP). These phases were separated by a major drying event and varying conditions. Between 11.3 cal ka BP and 7.7 cal ka BP an intermittent lake dominated. From 7.7 cal ka BP the basin evolved to the present day, occasionally-flooded playa environment.
The aeolian history of the study area is based on studies of sand sheets, dunes and sand ramps (eg., Lancaster,N. and P., 2003). Surprisingly, there are only a few luminescence ages of aeolian deposits from the eastern Mojave Desert, such as infrared stimulated luminescence (IRSL) ages by L. (1994) and M. and L. (1996), which would allow connecting aeolian activity with the lake history. V. et al. (2003) provided a review on the alluvial fan and aeolian history, integrating IRSL ages of aeolian deposits and radiocarbon ages of pedogenic calcium carbonates, precipitated in alluvial sediment along the Soda and Providence Mountains. There are three consistent aeolian phases. The oldest one (Qe1) has a basal age of 16.8 1.5 ka and appears to be linked with the varying phase of Lake Mojave (18.1 cal ka BP and 14.5 cal ka BP) between its two stable phases. The second aeolian phase (Qe2) ranges from IRSL ages of 8.3 0.8 ka to 3.5 0.2 ka. V. et al. (2003) suggest this phase is related to the recession and desiccation of Lake Mojave. The stratigraphically youngest phase (Qe3) has one basal IRSL age of 4.3 0.3 ka and might be related to a period of increased aeolian activity between 6.7 ka and 3.3 ka in this area (M. and L., 1996; V. et al., 2003).
The Cima volcanic field is situated some 20 km downwind, east of Soda Lake playa (Figure 1). More than 40 cinder cones and associated basaltic lava flows rest on alluvial sediments at elevations between 600 and 1500 m a.s.l. (Dohrenwend et al., 1984). Climate is currently arid with mean annual precipitation of 69 to 160 mm and mean annual temperatures from 21 to 15 °C, respectively (climate stations in Baker, 320 m a.s.l., and Yucca Grove, 1204 m a.s.l., (NCDC, )). Similar He exposure ages for pavement clasts and bedrock outcrops on basalt flows (G. et al., 1995) argue for the presence of clasts at or near the surface for the entire time since flow emplacement, several ten to hundred thousands of years ago. Surfaces of the two investigated lava flows (560 80 ka, 270 110 ka, (D. et al., 1984)) are predominantly flat, dissected by shallow drainage channels or valleys, and show several bedrock outcrops. All studied outcrops have comparably small specific catchments (1440 210 m, (Dietze et al., 2013)). Vegetation is concentrated in drainage channels. The stone pavements at the investigated sites are well-varnished, tightly packed and composed of clasts with mean diameters of 53 11 mm (1 ; (Dietze and Kleber, 2012)). Some clasts reach diameters of more than 200 mm.
3 Materials and Methods
3.1 Field work
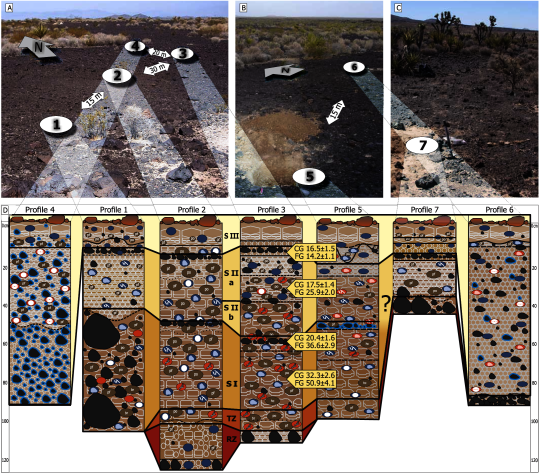
Sediment sections were chosen to be located in the least disturbed areas of abandoned lava flows, with intact stone pavements, free of vegetation. At each site at least two sections were used to investigate their proposed relationships but also to get an estimate of spatial variability. Two different flows were chosen to check for the possibility to extend stratigraphic relationships beyond just one flow. On the 560-ka flow, sections P 1 to P 3 are located 15 to 30 m apart, along a very shallow depression, on a barren patch of the lava flow (Figure 1 and 5). Section P 4 is situated perpendicular to this sequence near the vegetation-covered margin of the depression. Approximately 2 m west of section P 1, large angular blocks are exposed. Sections P 5 and P 6 are located 300 m north of the first topo-sequence. Section P 5 marks the central part of a barren stone pavement patch, approximately 80 m downslope of a 2 m high topographic step, formed by a lava outcrop. Section P 6 is located at similar proximity to the lava outcrop but a few metres from a vegetation-covered drainage channel. Section P 7 is located on the 270-ka flow, in the central part of a barren patch. It is covered by a tightly closed (¿ 90 %), well-varnished stone pavement. Between pavement clasts, loose aeolian material, 3 to 5 mm thick overlies the ca. 5 cm thick vesicular horizon. Detailed pedological descriptions of all sections (except for section P 7) were presented in Dietze et al. (2011), where the focus was on relative age parameters with a brief presentation of soil-morphological features. From each section bulk samples (ca. 500 g) were taken to gain at best three samples per field-designated horizon.
Grain-size analysis and end-member modelling analysis (EMMA) Air-dried sample aliquots between 0.2 to 0.7 g were suspended with sodium pyrophosphate for 24 h and placed in an ultrasonic bath for 15 minutes prior to measurement. Organic material and calcium carbonate were not removed (cf. discussion in D. (1991); Schulte,P. et al. (2016). Grain-size distributions were measured with a Horiba LA-950 laser diffraction particle sizer at GFZ Potsdam, providing 98 classes between 0.01 and 2500 µm. Each sample was measured for 5 s with ultrasonic excitation for 10 s in the device to mechanically disaggregate particles prior to each measurement (applying the Mie scattering theory with refraction index 1.55 and absorption index 1.33). The median distribution of 10 consecutive measurements per sample was used for further analyses.
The grain-size distributions of sediments can be a powerful proxy to characterise the conditions that formed the deposit. However, sediments usually show multimodal distributions as a result of syn- and/or post-depositional mixing. One fruitful approach is to statistically “unmix” such distributions by end-member modelling analysis: EMMA (Weltje, 1997; Dietze et al., ). EMMA uses principles of eigenspace analysis and different scaling procedures to describe grain-size distributions as a linear combination of end-member (EM) loadings and scores. Loadings are the fundamental, genetically interpretable grain-size distributions and scores are the relative contributions of each EM to each sample. EM loadings can be interpreted in terms of discrete sediment sources, transport pathways and/or transport processes, as discussed in the conceptual model of dynamic populations (J. and A., 2007). Each of these three factors tends to sort or fractionate arbitrary grain-size distributions and leads to distinct, typically unimodal distributions. However, the relative importance of each of these factors usually remains unresolved. In a first order approach EMs may be related to “transport regimes”, thus amalgamating transport pathways and processes as well as, to a lesser extent, sediment sources. As an example, interpreting an EM as “aeolian dune proxy” implies a process combination (saltation, reptation and leeward slide), narrows the pathway to a short-range distance and argues for a source area capable of rapidly delivering sand-sized particles. By this it is possible to identify (loadings) and quantify (scores) the depositional environment that generated a sediment deposit. EMMA was put forward by Weltje (1997) and rewritten as a Matlab script by Dietze et al. (). Dietze and Dietze () introduced a comprehensive package for the statistical software R which allows open-source comprehensive modelling. The technique has been successfully tested (J. and A., 2007) and applied to a wide variety of environmental archives (W et al., 2002; A. et al., 2007; Dietze et al., 2014).
EMMA was performed with the R-package EMMAgeo (Dietze and Dietze, ), following the steps described in Dietze et al. (). A total of 67 samples (m) was used. The lowermost sample of section P 2 was dismissed as it showed a completely different grain-size distribution compared to the other samples (sand content 77 %; Figure 2) and would have biased the model. From the original 98 grain-size classes those were truncated that contained only zeros, yielding 77 classes (n). The two main parameters that determine the modelling results are the number of EM (q) and the range limits for data scaling with a weight transformation (lw; Dietze et al. ()). The threshold for the minimum number of EM (qmin) was set to R = 0.9. The maximum number of EM (qmax) was set by the first local maximum R of all models using 2 to 20 EM. Model optimisation was performed with a sequence of 50 values for lw ranging from 0 to 0.0224 (i.e. 95 % of the maximum possible value) and q between qmin and qmax. Robust EM scenarios (threshold R = 0.75) were isolated with class limits bracketing individual modes and k-means cluster analysis was performed to investigate the resulting distribution of EM modes. Robust EM were calculated as medians and quartile ranges of the isolated scenarios. Evaluation of model results was based on mean total, sample-wise and class-wise R between original and modelled data. The supplementary material contains the grain-size data set and the R-script used for EMMA. EMMA introduces artificial modes, usually in classes where other EM have their primary modes or where other end-members overlap J. and A. (2007); Dietze et al. (). This is due to the constraint that the model aims to produce extreme EM in order to describe most of the variability of the data set. Hence, only the primary modes or those modes that are not at positions of other EM modes should be interpreted genetically.
3.2 OSL dating
From section P 3 (Figures 1 and 2) four samples for optically stimulated luminescence (OSL) were taken at depths of 14 cm (GI70), 31 cm (GI71), 53 cm (GI72) and 74 cm (GI73). Sampling was done at night using subdued red light (660 nm). A freshly cleaned horizontal surface (50 cm by 50 cm) adjacent to the pit was prepared and deepened until the desired sampling depths were reached. From each sampling plane, a ca. 2 cm thick slice of sediment was filled into opaque plastic bags until ca. 1 kg material was sampled. Material for dose rate determination was taken separately.
Luminescence dating was carried out at the Luminescence Laboratory of the Justus-Liebig-University of Giessen, with two Lexsyg Luminescence Readers Lomax,J. et al. (2014). All samples were treated with H2O2 and 10 % HCl. The sieved coarse-grain quartz fraction (90-200 µm) was subject to a density spearation (lithium-heteropolytungstate, = 2.68-2.62 g/cm), etching with 40 % HF for 80 min and rinsing in 10 % HCl for 30 min. The fine-grain quartz fraction (4-11 m) was extracted by sedimentation and etched with 34 % pre-treated HSiF for several days. For details see Fuchs et al. (2015). Between 16 and 20 aliquots (mask size 4 mm) were measured for the coarse-grain samples and 7 aliquots for the fine-grains samples. Quartz standard measurements were carried out using the SAR protocol (S. and G., 2000, 2003). For stimulation, green LEDs (525 25 nm, 70 mW/cm2) were used. OSL-emissions were filtered by a Semrock HC377/50 (5 mm) + BG3 (3 mm) filter. Preheat and cutheat temperatures were set to 260 °Cand 220 °C. Radionuclide concentrations were determined using alpha counting (U and Th) and ICP-MS (K). The concentrations were converted to dose rates using the conversion factors of Adamiac,G. and Aitken,M.J. (1998). Cosmic dose rates were calculated based on geographic position and sampling depth below surface R. and T. (1994). Based on the porosity and the measured water contents of the samples, a water content of 73 % was used to calculate the dose rate. For De calculations and OSL plots, the R-package Luminescence was used (Team, ; Dietze et al., 2016).
4 Results
4.1 Sedimentological results
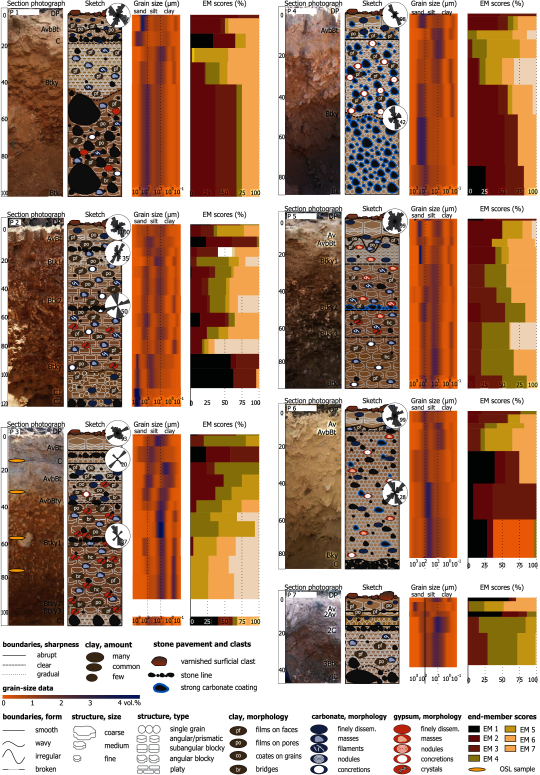
Figure 2 shows the soil-morphologic characteristics (after Dietze et al. (2011)) and grain-size properties of all investigated sections. The stone pavement at all studied sites is well-varnished and tightly closed (¿ 90 % coverage). On top of the Av horizon a thin veneer of loose, quartz-rich material is always present. The Av horizon contrasts with an underlying horizon of single grain or weakly to moderately developed, medium subangular blocky soil structure.
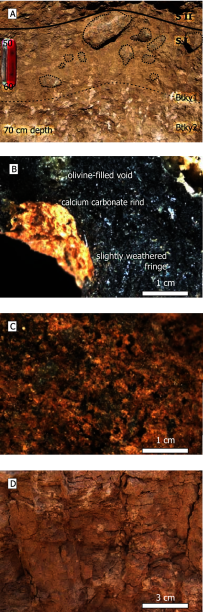
Buried vesicular horizons and stone lines occur in several sections. Stone lines (Figure 3A) cluster at two typical depths, 10 to 20 and 50 to 60 cm, and exhibit preferred bimodal alignment patterns (rose diagrams in Figure 2; after Dietze and Kleber (2012)). The basalt clasts are virtually unweathered (Figure 3B). In contrast, clasts at the bottom of the sections are strongly weathered or nearly disintegrated, with abundant altered minerals (Figure 3C). Furthermore, in the basal part of section P 2 a pocket within basaltic cobbles and boulders is filled with virtually dust-free sand and gravel derived from basalt and cinder as well as some coarse quartz grains. The filled pocket shows no signs of krotovina or other turbation processes.
4.2 End-member modelling analysis
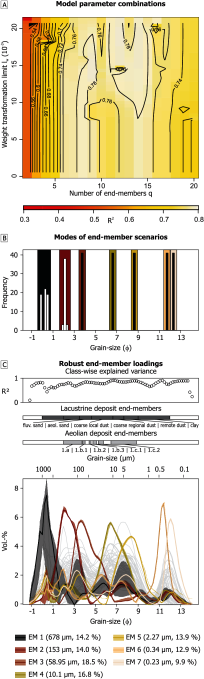
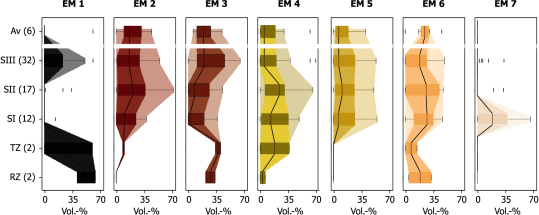
Figure 4A shows the explained variance (R) of the model depending on the number of EM q and weight transformation limit lw. Highest rising limb R values are reached with q between 6 and 8. The mode positions of all possible EM between qmin and qmax and within the 50 values of lw (n = 775; cf. Figure 4B) form seven discrete clusters. A k-means cluster analysis with seven cluster centres covers 99.86 % of the data. Hence, q was estimated to be seven. Based on a series of 50 model runs with q = 7 the optimal lw was estimated to be 0.016. This parameter combination resulted in an optimal EM model with average total explained variance of R = 0.82. Mean row-wise (sample-wise) and column-wise (class-wise) R was 0.84 and 0.81, respectively. Bar plots in Figure 2 show EM scores for all sections, i.e. the contribution of each EM to the sample. Figure 4C shows the robust EM loadings with their respective uncertainty, i.e. quartile ranges. These seven robust EM loadings have distinct individual modes (Figure 4C) and comparably small uncertainties (thin polygons). However, they also contain suppressed, secondary modes, mainly below the modes of other EMs. The explained variance per EM loading is roughly equal, between 10 and 19 % (Figure 4C). Figure 4C also comprises the ranges of common grain-size EM found in lacustrine sedimentary archives across the Tibetan Plateau (Dietze et al., 2014) and the ranges of loess modes as described by (Vandenberghe,J., 2013), which were intensively discussed in terms of general sorting trends due to sediment sources, transport and deposition characteristics.
4.3 Section correlation and composite section
Figure 5 shows the correlation of the inferred stratigraphic units and their associated soil sections across the study area. The basal rubble zone (RZ; G. et al. (1985)) with strongly weathered clasts and sandy to gravelly detritus is exposed in several sections. Stratigraphically above the RZ is a transition zone (TZ) which grades upward into layers dominated by aeolian deposits. Overlying the TZ the sections basically exhibit three accretionary aeolian units (abundant quartz grains throughout the silt-dominated clast-poor matrix; Dietze et al. (2011)) all of which are pedogenetically altered.
Unit S I (see figure 2 for detailed graphical representations of soil properties) is characterised by strongly developed coarse subangular blocky to angular blocky structure and prominent clay-morphological features of various types. The soil matrix is engulfed with masses, filaments, crystals and concretions of calcium carbonate and gypsum. Clay content is relatively high in this unit (dominance of EM 6 and 7). Coarse sand contents (EM 1 and 2) decline remarkably compared to the RZ and TZ. Clast content is low except for section P 1, located close to a bedrock outcrop. In some sections the unit ends abruptly with a stone line at a depth of 50-60 cm (Figure 3A). A buried Av horizon was not found.
Although soil structure of unit S II is moderately to strongly developed subangular blocky to angular blocky or partly platy (section P 3), clay contents are typically lower compared to S I. Few to common clay films appear on ped faces and line pores. Calcium carbonate occurs predominantly as masses and filaments. Gypsum morphology is diverse (i.e., filaments, nodules or crystals) and visible gypsum may also be entirely absent. Clast content in this unit is also low. EM 2 3, 4 and 5 dominated. Another stone line at a depth of 10 to 20 cm and a buried vesicular horizon below it can be present. The unit may be separated into a lower unit S II a with a lower sand content and more strongly developed soil structure and an upper unit S II b with more contribution of coarse material and an overall weaker soil structure.
Unit S III has, apart from the vesicular horizon, a single-grain to weakly developed subangular blocky soil structure. Calcium carbonate and gypsum morphologies appear to be very weakly developed and consist of finely disseminated features to masses. Secondary clay morphology is also weakly developed and reduced to films on pores. The vesicular horizon was developed equally well in all sections with a strong and coarse prismatic structure and medium hard to hard consistence (Dietze et al., 2011). This unit is capped by the modern stone pavement.
The studied sections can be divided into two distinct morphological types, based upon clast content and distribution as well as degree of pedogenetic sediment overprint (structure, clay morphology, colour change of fine material). Type I (sections P 1, P 2, P 3, P 5 and P 7) mainly consists of aeolian material that has a low clast content, shows significant pedogenetic alteration and complex stratigraphic subdivisions (Dietze et al., 2011). Type II (sections P 4 and P 6) is clast-rich throughout the sediment column while aeolian fines are mainly filling voids. Pedogenetic alteration is weak. The sections consist entirely of unit S III. Type II is commonly found near local drainage channels. In the topo-sequence (Figure 5A), the form of the shallow depression is represented by the section characters: section P 4 at the depression margin contrasts sharply with the other three sections (P 1 to P 3). Interpretation of the basal part of section P 1 as S I rather than as RZ is supported by the high scores of EM 2 to 7 and a lack of EM 1. Assignment of the basal part of section P 7 to S I or S II is equivocal, though it is very similar to section P 1 in terms of soil horizonation and morphology.
4.4 OSL ages
OSL dating results, including analytical data, are listed in Table 1 and plotted in Figures 5 and 6. Results are discussed in detail in Fuchs et al. (2015). OSL signals are dominated by a fast component, even though a small medium component is detectable. However, due to the generally positive OSL characteristics, checked by dose recovery tests, preheat plateau tests and the identification of typical quartz 110°C TL peaks as well as the absence of IRSL signals, precise De values based on a SAR protocol after S. and G. (2000) could be determined and used for the central age model (F. et al., 1999). The abanico plots in Figure 6 allow a comprehensive view of both error characteristics and dose distributions of the measured samples. It is obvious that the dose distributions (kernel density estimate curves, i.e., right axis of the plots in Figure 6A) of the coarse-grain samples have a large scatter and overlap significantly whereas they are much better separated for the fine-grain samples. Furthermore, the majority of the fine-grain De values are within 2 standardised estimates around the error-weighted mean of each sample (percentage of aliquots in confidence interval as denoted in Figure 6), which is not the case for the coarse-grain samples. Precisions of measured aliquots are comparable between fine- and coarse-grain measurements.
[Table 1]
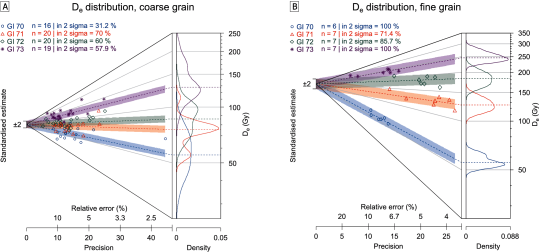
Coarse-grain ages range between 32.32.6 and 16.51.5 ka. Fine-grain ages cover a time span of 50.94.1 to 14.21.1 ka. Coarse-grain ages deviate significantly and systematically from fine-grained ages; the average age offsets are -2.3 ka, 8.4 ka, 16.2 ka and 18.6 ka, respectively. A very rough estimate of average sedimentation rates based on the fine-grain samples gives values of 13.3, 20.6 and 15.4 mm/ka. Age inversions are not present.
5 Discussion
5.1 End-member interpretation
The coarse sand-dominated EM 1 (mode at 0.56 ) is regarded to represent “local detritus”, created by either in situ clast fragmentation and/or high-energy particle transport by surface runoff. Shape and mode of EM 1 (Figure 4C) is also similar to the fluvial sand EM of Dietze et al. (2014) who compiled robust EM from lakes across the Tibetan Plateau. EM 2 has a mode at 2.71 . Its grain-size mode is close to the mean grain-sizes of dunes and sand ramps throughout the eastern Mojave Desert (P. and Lancaster,N., 2002; D. et al., 2012; Sweeney et al., 2013). Accordingly we interpret it as an analogy of dune sand from a proximal source. The secondary mode around 8 is clearly an artefact as it coincides with the overlap of the primary modes of EM 4 and 5 (cf. Materials and Methods chapter). EM 3 shows similarities to a material termed “proximal desert dust” (recruited from e.g. local washed, Sweeney et al. (2013)) with a primary mode around 4.08 and a secondary mode between 5.6 and 9.0 . EM 4 with a mode at 6.63 is interpreted as “regional dust”, which represents episodic background deposition from high-level suspension cloud taking up sediment from larger distances (100-1000 km; Vandenberghe,J. (2013); Dietze et al. (2014)). EM 5 (mode at 8.78 ) represents “remote dust”, generated from even longer travel distances in atmospheric levels up to 7 km (Vandenberghe,J., 2013). EM 6 and EM 7 are dominated by the clay fraction (modes at 11.52 and 12.09 , respectively). As there is no sediment transport process that primarily enriches these finest grain-size fractions in such a system, neoformation and/or enrichment of translocated clay (termed clay enrichment further on) is the most likely explanation for the composition of these EM. Sediments from the Soda Lake playa were very clay-rich during pluvial stages (G. et al., 2003) but such fine particles could only be transported to the sampled sections as e.g. silt-sized aggregates. If this was the case, which cannot be resolved here, then EM 6 and EM 7 definitely need to be discussed in terms of a secondary enrichment process rather than a primary one, tightly coupled with a nearby sediment source (also cf. EMMA description in Materials and Methods chapter). The grain-size maps (Figure 2) show that the clay fraction indeed consists of two discrete grain-size populations. Tests with a truncated data set (only grain-size classes between 0.01 and 1.0 µm) returned the same two EM with nearly identical shapes and mode positions (not shown).
Figure 7 provides a summary of the relative contributions of each EM to the stratigraphic units and the vesicular horizon separately. With only two samples each, the rubble zone (RZ) and transition zone (TZ) lacks statistic robustness. However, these data do offer insights into sediment sources and their relative mixing. The local detritus EM 1 dominates the RZ (around 50 %), decreases in the TZ (about 30 %) and plays only a marginal role in the aeolian units. The increased contribution in unit S III is mainly due to the buried stone layers, the loose material on top of the Av horizon and the inclusion of type II sections in this unit. In contrast and with the exception of the regional dust EM 4, all aeolian EM (EM 2, 3, 5) increase from virtually zero contribution in the RZ towards 13 to 23 % on average in the accretionary units S I to S III, supporting the principal idea of an accretionary aeolian mantle. EM 3 is high in the TZ and unit S III, indicating the onset and prevalence of dust depostion. EM 7 is almost exclusively associated with S I (only a few outliers in S II and S III), which was deposited prior to 20.4 1.6 ka. This means pedogenetic alteration occurred under full pluvial conditions with a significantly different moisture regime (e.g., D. et al., 1986). Thus, EM 7 is interpreted as clay enrichment under moist conditions, i.e. through translocation and/or neoformation. In contrast, EM 6, consisting of slightly coarser clay, persists in all three accretionary units, including the topmost vesicular horizon (Figure 7) and appears to be insensitive to the pedogenetic moisture regime.
In all stratigraphic sections the surface vesicular horizons have distinct properties. They always contain considerable amounts of enriched clay (EM 6 scores around 25 %) and aeolian EM 2 to 5. In contrast, loose fine-grained material on top of Av aggregates usually lacks significant enriched clay, may contain local detritus (EM 1) and is dominated by proximal aeolian sediments (EM 2 and 3). These findings are in complete agreement with the suggested genesis of vesicular horizons: aeolian dust is trapped on the surface, and with rainfall the fine fractions of this material are translocated along aggregate boundaries to the ped interiors through elongated macropores (D. et al., 1998; Anderson et al., 2002). According to Dietze et al. (2012), the coarse fractions of the loose material on top of the Av horizon remain at the surface and are eventually removed by surface runoff, a process that fits well with the increased scores of EM 1 in material overlying the Av horizon.
5.2 Environmental proxy data
Three major processes dominate the properties of the studied sections: i) accretion of aeolian material, ii) admixture of coarse material, delivered by weathering and lateral translocation and iii) pedogenetic alteration. These processes are clearly reflected by the grain-size compositions, unmixed with EMMA.
Sections P 4 and P 6 are composed of clasts, local detritus and proximal to remote aeolian sediment, supporting their morphology-based classification as type II and their formation by runoff-transported clasts and either subsequent infilling of aeolian material or syn/postgenetic inwash of young fine material (Dietze et al., 2011). Indeed, properties of sections P 4 and P 6 resemble those associated with the “bare ground 1” mosaic type of A. et al. (2005b): “predominance of calcium carbonate-covered rock fragments”, mainly of cobble size. However, these mosaic types are associated with proximal bedrock outcrops and show a pavement cover ¿ 54 % with clasts being not closely packed (A. et al., 2005b). This configuration stands in contrast with the surface properties described for sections P 4 and P 6 (Dietze et al., 2011).
Vesicular horizons are ubiquitous in the upper part of unit S III. However, a buried vesicular horizon in unit S II just below a buried stone pavement highlights the systematic coupling of both features with an older land surface buried within the accretionary deposit. If another vesicular horizon existed below unit S II and has just been overprinted/reworked by pedogenesis cannot be resolved. Both, vesicular horizons and stone pavements can be interpreted as environmental proxies. Dietze et al. (2012) inferred control parameters of Av horizon formation and properties from field data and laboratory experiments. They concluded that vesicular structure can form in a wide range of fine-grained sediments (i.e. sand contents between 0 and 90 %, carbonate contents between 1 and 28 %, electric conductivity between 800 and 5600 µS/cm) and under diverse wetting and drying conditions (i.e. wetting intensities, wetting types, drying temperatures) but that root density of grasses is the dominant limiting factor of vesicular horizon integrity (i.e. thickness, firmness, vesicle size). With increasing moisture, vegetation cover increases systematically. In the Black Rock Desert, southern Sevier Basin, Utah, stone pavements and associated vesicular horizons exist up to a mean annual precipitation of approximately 300 mm (Dietze et al., 2012). In this area, characterised by a sharp, topography-controlled precipitation gradient, former stone pavements give way to grasses and shrubs with increasing moisture. The former pavements are, however, not visually disturbed by the vegetation growth. Hence, vegetation tends to destroy or prevent formation of a vesicular horizon; the key feature for maintaining a clast cover at the surface by swell-shrink processes.
If a stone pavement is buried below aeolian material, some other geomorphic agent must serve as aeolian sediment trap. During glacial times vegetation zones of the Mojave Desert shifted to lower elevations. According to G. (1990) and Quade,J. (2001), the study area was vegetated down to elevations below 400 m a.s.l. during the Last Glacial Maximum (LGM). A. et al. (2005a) also present pollen-based reconstructions of Central Mojave Desert vegetation compositions that point at shrub and grass covers down to elevations of 305 m asl. during the Early Holocene. Grasses are perhaps the most quickly migrating and spatially extensive type of vegetation, with seeds able to settle even within tightly closed stone pavements. Grasses could have acted as an alternative and very effective agent for dust trapping, whether due to increased trapping efficiency or reduced erosion of deposited particles. As little as 15 % ground cover by patchy grasses results in 80 % of the accumulation rate of a completely vegetated surface (Yan,Y. et al., 2011). A similar threshold (15-20 % cover, Shinoda,M. et al. (cf. 2011)) results in a sharp drop in the erodibility of a surface. Thus, even a patchy grass cover would allow accretionary growth without a maintained stone pavement and Av horizon, given a sufficient dust flux. However, climatic conditions must favour sufficient vegetation density, i.e. higher effective moisture during the cold episodes of the Quaternary. Contrary, with increasing dryness, grass cover density decreases and i) allows the formation of vesicular soil structure and ii) increasing potential of clast routing over the surface by unconcentrated overland flow (Dietze and Kleber, 2012; Dietze et al., 2013). At least at small scale, erosion of the fine-grained vesicular horizon material from disturbed plots does not occur. Rather, these plots become recovered by clasts through lateral movement (Dietze et al., 2013). The supposed 1000 m downward migration of vegetation zones during the LGM renders the study area a highly variable transition zone. Therefore, even brief changes of effective moisture may have significant impact on vegetation cover. Liu,T. and S. (2007) discuss several such short switches in the regional climate of the region during the latest Pleistocene and Holocene. Similar brief intervals during which “stone horizons” formed on a sand ramp in the Mojave Desert are discussed by D. et al. (2012).
Systematic bimodal and slope aspect-symmetrical clast orientation patterns in stone pavements are another environmental proxy. Dietze et al. (2013) showed how such orientation patterns can be attributed to lateral clast transport by unconcentrated overland flow over the fine-grained and firm vesicular horizon, while leaving the fine-grained material uneroded. Lateral delivery of fresh clasts, e.g. by overland flow, is essential to form a new generation of stone pavement after the burial of an older one. Accordingly, in sections with buried stone pavement generations, stone pavements with bimodal clast orientation patterns may indicate a period of i) frequent unconcentrated overland flow together with climatic conditions that support ii) prior formation of a firm but fine-grained surface (i.e. the vesicular horizon) and iii) a considerably decreased vegetation cover.
Hence, the threefold succession of accretionary mantle and stone pavement can be interpreted in terms of a system operating in two modes: A) formation of an initial clast layer after an Av horizon has formed on a barren surface under dry conditions and B) accretion of fine material and burial of an existing clast layer once effective moisture supports a sufficient vegetation cover. Certainly, the lowest stone pavement (i.e. the stone line at 50-60 cm depth) may have formed solely by accretionary rise after lava flow emplacement. However, the two other stone pavement generations must have migrated onto younger accretionary units during climatic conditions that favoured lateral clast transport. Postdepositional exhumation of buried clasts by turbation processes (e.g., Cooke et al., 1993) is not at all supported by these findings.
The control mechanism of mode A is most likely aridity, as discussed above. The dominant control mechanism of mode B is sediment flux intensity and vegetation as trapping agent. Similar mechanisms were also suggested by Stauch,G. et al. (2012) for dust trapping on the Tibetan Plateau. In the case discussed here, this flux consists of a proximal (EM 1, 2), a regional (EM 3) and a remote (EM 4, 5) component. All three spatial components of dustfall are linked to external drivers as well, but at different scales. Proximal sediment flux can be linked to local rainfall on the basalt flows (EM 1) as well as deflation of material from adjacent alluvial washes (EM 2). Regional activity is linked to the degree of lake-level stability of the Soda Lake playa and, hence, to discharge of the Mojave River, originating in uplands 250 km to the west of the study area. Global dust activity again follows different trends (e.g., Shao, 2008). In summary, both modes A and B are controlled by climate but this signal is significantly superimposed on and modulated by regional and local components of geomorphologic activity and stability.
There is a consistent correlation of six sections on one 560-ka basalt flow, which can be of two distinct morphological types. Beyond this, sections from lava flows of different age and several km away can be integrated into this framework. Section P 7 on the 270-ka flow (Figure 5) is one such example. Another example are two soil-sediment sections described by Dietze et al. (2011), situated on a ca. 12 ka lava flow (D. et al., 1986). These two sections resemble, based on their morphologic and grain-size distribution properties, unit S III with an OSL deposition age of ¡ 16.5 1.5 ka. Hence, at least among flows of the Cima volcanic field the stratigraphic correlation of sections can be extended beyond just one basalt flow.
5.3 OSL data
The OSL age offsets between the coarse and fine grain samples are not due to different estimates of water contents. The influence of the included alpha component for the fine-grain samples also does not account for the large and systematically increasing age offsets with depth. Accordingly, the age offset is indeed best explained by different deposition ages for the two grain-size fractions. The coarse-grain OSL samples are composed of EM 2 (dune sand) and EM 3 (proximal desert dust), whereas the fine-grain OSL samples are composed of EM 4 and EM 5, i.e. remote loess components. Apparently, there is a postdepositional mixing of these four EM and, hence, their equivalent doses. Figure 3D shows unit S I (depth ca. 60 to 80 cm) of section P 3, with vertical cracks, several cm to few dm long. These cracks are preferential flow paths and allow downward transport of sediment grains during rain-induced soil wetting events (Anderson et al., 2002). Hence, fine-grain OSL ages may be interpreted as primary deposition ages of far-travelled loess with only minor post-depositional reworking. In contrast, the coarse-grain OSL ages are interpreted as phases of subsequent infilling of proximal aeolian material along the vertical cracks (Figure 3D; cf. discussion in Sweeney et al. (2013)). This subsequent emplacement (and admixture to the fine-grained matrix by closing of the cracks after thorough soil wetting) of coarse grains is also supported by the comparably high overdispersion or scatter in individual De values (broad kernel density estimate curves in Figure 6A). For a detailed discussion on these issues see Fuchs et al. (2015). Since the fine grain ages of section P 3 are interpreted as representing primary deposition of sediment, these are used as age control for the correlated sections and serve as base for the following interpretation.
5.4 Landscape evolution on the basalt flows
The accretionary sections on lava flows of the Cima Volcanic field record aeolian activity, vegetation dynamics, pedogenic boundary conditions and surface runoff characteristics. Thus, they allow a comprehensive interpretation of the environmental conditions that provided the framework of their formation through time and allow a refinement of the model presented by G. et al. (1985). Periods of dust accretion as well as surface and subsurface modification can be characterised and put into context with other environmental archives in this study area. Certain episodes of environmental activity can be characterised in great detail, while others remain vague or even unresolved.
After lava flow emplacement, 560 and 270 ka ago, the flow surfaces began to degrade by weathering and colluviation of clasts into local topographic lows (cf. detailed discussion in G. et al. (1985)); the RZ forms. The onset of documented aeolian activity is marked by the formation of the TZ, dominated by proximal desert dust (EM 3). Thickening of the allochthonous mantle decoupled site and soil characteristics from bedrock-determined properties.
The formation of aeolian unit S I started before 50.9 4.1 ka and ended some time prior to 36.6 2.9 ka (i.e. primary deposition of fine-grained aeolian material as indicated by the fine-grain quartz OSL ages, cf. Figures 2, 5 and 6). It marked a significant change in sediments and processes. Whether a stone pavement formed a surface cover and has been lifted synsedimentary or was formed later by lateral processes cannot be resolved. One way or the other, the bimodal clast alignment pattern argues for some rearrangement of the rock fragments by lateral processes (Dietze et al., 2013). The OSL age of 50.9 4.1 ka within unit S I implies that formation of this unit started prior to Afton Canyon incision (25 cal ka BP) but overspill discharge of the Mojave River into the Soda basin during OIS 4/6 (C. and L., 2008; C. et al., 2015) is a plausible source of aeolian material. The timing of the onset of this aeolian accretion period remains unresolved. However, as there are no significant changes in soil-morphologic and sedimentologic properties, it is unlikely that unit S I was formed over much larger time scales than several ten thousand years. Under full pluvial climate clay was enriched and formed a distinct grain-size fraction (EM 7).
Accretion of unit S II and burial of the stone pavement associated with S I started after 36.6 2.9 ka and ended latest 14.2 1.1 ka, as the two OSL ages at its base and top imply. We infer that the onset of Lake Mojave I is approximately recorded by the OSL sample at 33 cm depth (25.9 2.0 ka). Thus, the lower 20 cm of this unit were accumulated before Lake Mojave formed but when the Mojave River already delivered water to the Soda basin (several highstands between 42 cal ka BP and 25 cal ka BP; C. and L. (2008); C. et al. (2015)). A slightly younger aeolian activity onset was noticed by Lancaster,N. and P. (2003), who describe a sand ramp at Hanks Mountain, near Silver Lake Playa (Figure 1) with a maximum IRSL deposition age of 34.7 ka. The upper 18 cm of unit S II were apparently deposited during more than 3000 years of lake level instability. This is also witnessed by an aeolian activity phase (Qe3) throughout the eastern Mojave Desert (V. et al., 2003), before the lake reached a second stable highstand between 14.5 and 11.3 cal ka BP (G. et al., 2003). This stable phase may have provided a sufficient time window for the formation of a new generation of stone pavement during a short period of increased aridity and thus decreased grass cover density (cf. aridity pulse around 14 ka in Liu,T. (2003) or between Younger Dryas and Holocene wet phase WH12 in Liu,T. and S. (2007)).
Accretion of unit S III resulted in the burial of the stone pavement on top of unit S II and started after 14.2 1.1 ka (OSL age at the lower boundary of S III). Unit S III shows only weak pedogenetic modification. After 11.3 cal ka BP Lake Mojave stands became intermittent and the lake ultimately disappeared after 7.7 cal ka BP, evolving to the present playa environment in the Holocene (G. et al., 2003). A regionally recognised aeolian activity phase (Qe2) is evident between 8.4 and 3.5 ka (McDonald et al., 2003). However, unit S III is likely to be still actively growing as witnessed by studies on modern dust fluxes (e.g., C., 2006) or 2 cm thick incipient vesicular horizons below gravel roads abandoned for not more than 25 years (Dietze et al., 2012). Micromorphological evidence (Anderson et al., 2002) also point at continuous accretion during modern times.
6 Conclusions
Accretionary soils under stone pavements are a key archive – at least in environments such as the eastern Mojave Desert – to resolve aeolian pulses and their interaction with local slope processes, a function that other terrestrial archives in arid landscapes apparently fail to provide. EMMA of the accumulated sediments allows to resolve four different aeolian components and to identify two different clay formation/enrichment components. Buried and surficial stone pavements as well as vesicular horizons provide insight into past vegetation coverage and runoff regimes. The OSL-based chronology allows results from accretionary deposits to be linked with other environmental information, e.g. aeolian activity phases.
Surface evolution of the investigated Pleistocene lava flows in the Cima volcanic field represents an example of temporally and spatially complex interaction of geomorphologic and pedogenetic processes. Prominent small-scale differences in subsurface properties may only be resolved by interpreting a series of sediment sections rather than a single soil pit. Correlated soil-sediment sections reveal three distinct periods of aeolian sediment deposition, stone pavement development and soil formation. However, during at least the last 50.9 ka aeolian dust accretion was the overwhelming process contributing to surface modification on the lava flow. Perhaps some older, more mature material may be inherited and recycled during the formation of the young deposits. This needs to be considered when interpreting relative (soil) age indices.
The onset of massive dust activity may have been impossible without a key trigger: the arrival of Mojave River water to the Soda Lake basin and eventually formation of a lake system with different phases of lake level stability. Sweeney et al. (2013) found arguments for alluvial systems as primary source of dust in modern vesicular horizons in the Mojave River basin rather than playas. However, the three accretionary units are connected to the lake history and contain a considerable proportion of regional and remote aeolian dust. At least for these three units the climate- and overspill-controlled lake level probably was more important. According to C. (2006), modern dust fluxes ( 50 µm, corresponding to EM 3 to 7) in the arid southwestern United States are between 2 and 20 g/m/a. Assuming a mean raw density for the deposited material of 2 g/cm this relates to a deposition rate of 2.2 mm/ka, which is one order of magnitude lower than the estimates based on the OSL-dated samples. Thus, at least the two lower aeolian units must have formed during a tremendously increased aeolian sediment flux.
The three stratigraphic units containing aeolian materials are each covered by a stone pavement, which indicates formation by lateral processes. Formation of this clast-dominated surface cover type requires a barren surface. However, buried stone pavements argue for a dust-trapping mechanism other than clasts: perhaps an increased grass cover. Therefore, stone pavement formation may be best explained to take place during periods of increased aridity. In the case of the Cima volcanic field, these aridity pulses may have forced grass communities to temporarily migrate to higher elevations than usual during more pluvial conditions. The barrenness allowed formation of the vesicular horizon, lateral transport of reworked or freshly exposed clasts by unconcentrated overland flow and clast alignment upon collision to form a new generation of stone pavement. Accordingly, stone pavement formation in this setting is an episodic phenomenon rather than a time-transgressive one, which has implications for its interpretation as a palaeo-environmental archive and as surface age indicator.
7 Acknowledgements
We kindly thank the Derek Booth, Merith Reheis and an anonymous reviewer for their trust, endurance and valuable help on improving the article. We also thank the NPS authorities for patiently accommodating the needs of this project. We further thank Dominik Faust for discussions on earlier versions of the manuscript, Beate Winkler and Sieglinde Gerstenhauer for the laboratory work and Stefan Liening for grain-size measurements.
References
- Development of vegetation in the central mojave desert of california during the late quaternary. Palaeogeography, Palaeoclimatology, Palaeoecology 215 (3-4), pp. 297–311. Cited by: 1, 5.2.
- Late quaternary aeolian dust input variability on the chinese loess plateau: inferences from unmixing of loess grain-size records. Quaternary Science Reviews 26 (1-2), pp. 230–242. Cited by: 3.1.
- Surface mosaic map unit development for a desert pavement surface. Journal of Arid Environments 52 (3), pp. 305–317. Cited by: 1.
- Surface control of desert pavement pedologic process and landscape function, cima volcanic field, mojave desert, california. Catena 59 (2), pp. 205–230. Cited by: 1, 5.2.
- Doseârate conversion factors: new data. Ancient TL 16, pp. 37–50. Cited by: 3.2.
- Desert pavement characteristics on wadi terrace and alluvial fan surfaces: wadi al-bih, u.a.e. and oman. Geomorphology 35 (3-4), pp. 279–297. Cited by: 1.
- Pedogenesis of vesicular horizons, cima volcanic field, mojave desert, california. Soil Science Society of America Journal 66 (3), pp. 878–887. Cited by: 1, 1, 5.1, 5.3, 5.4.
- Bayesian analysis of radiocarbon dates. Radiocarbon, pp. 337–360. Cited by: 2.
- Lake manix shorelines and afton canyon terraces: implications for incision of afton canyon. Late Cenozoic Drainage History of the Southwestern Great Basin and Lower Colorado River Region: Geologic and Biotic Perspectives, pp. 227–259. Cited by: 2, 5.4, 5.4.
- Directly dated mis 3 lake-level record from lake manix, mojave desert, california, usa. Quaternary Research (United States) 83 (1), pp. 187–203. Cited by: 5.4, 5.4.
- A 16-year record of eolian dust in southern nevada and california, usa: controls on dust generation and accumulation. Journal of Arid Environments 67 (3), pp. 487–520. Cited by: 5.4, 6.
- [12] Cal-atlas. Note: Available at http://atlas.ca.gov/ (2014/09/29) Cited by: 1.
- Desert geomorphology. UCL Press, London. Cited by: 1, 5.2.
- On the formation of sand ramps: a case study from the mojave desert. Geomorphology 161-162, pp. 93–109. Cited by: 1, 5.1, 5.2.
- The effect of pretreatment on size analysis. Principles, Methods, and Application of Particle Size Analysis, pp. 34–42. Cited by: 3.1.
- Influences of quaternary climatic changes on processes of soil development on desert loess deposits of the cima volcanic field, california. Catena 13 (4), pp. 361–389. Cited by: 1, 1, 5.1, 5.2.
- The vesicular layer and carbonate collars of desert soils and pavements: formation, age and relation to climate change. Geomorphology 24 (2-3), pp. 101–145. Cited by: 1, 1, 1, 5.1.
- Cumulic soils formed in eolian parent materials on flows of the cima volcanic field, mojave desert, california. Surficial Geology of the Eastern Mojave Desert, California. Geological Society of America. Cited by: 2.
- Climatic influences on rates and processes of soil development in quaternary deposits of southern california. Special Paper of the Geological Society of America, Vol. 216. Cited by: 1.
- Strongly dust-influenced soils and what they tell us about landscape dynamics in vegetated aridlands of the southwestern united states. Special Paper of the Geological Society of America, Vol. 500. Cited by: 1.
- Evolution of reg soils in southern israel and sinai. Geoderma 28, pp. 173–202. Cited by: 1.
- [22] An end-member algorithm for deciphering modern detrital processes from lake sediments of lake donggi cona, ne tibetan plateau, china. Sedimentary Geology 243â244. Cited by: 3.1, 3.1.
- Sediment transport processes across the tibetan plateau inferred from robust grain-size end members in lake sediments. Climate of the Past 10 (1), pp. 91–106. Cited by: 3.1, 4, 4.2, 5.1.
- Formation mechanisms and control factors of vesicular soil structure. CATENA 99, pp. 83–96. Cited by: 5.1, 5.2, 5.4.
- [25] EMMAgeo: end-member modelling algorithm and supporting functions for grain-size analysis. Note: Available at http://cran.r-project.org/package=EMMAgeo (2014/09/29) Cited by: 3.1, 3.1.
- Alignment of stone-pavement clasts by unconcentrated overland flow â implications of numerical and physical modelling. Earth Surface Processes and Landforms 38 (11), pp. 1234–1243. Cited by: 2, 5.2, 5.2, 5.4.
- Contribution of lateral processes to stone pavement formation in deserts inferred from clast orientation patterns. Geomorphology 139-140, pp. 172–187. Cited by: 2, 2, 4.1, 5.2.
- The abanico plot: visualising chronometric data with individual standard errors. Quaternary Geochronology 31, pp. 12–18. Cited by: 3.2.
- Ambiguities of relative age indicators on abandoned surfaces of arid environments. Zeitschrift für Geomorphologie SI 3 55, pp. 49–75. Cited by: 1, 4.1, 4.3, 4.3, 4.3, 5.2, 5.2.
- K-ar dating of the cima volcanic field, eastern mojave desert, california: late cenozoic volcanic history and landscape evolution. Geology 12, pp. 163–167. Cited by: 2.
- Surface stone cover on desert hillslopes; parameterizing characteristics relevant to infiltration and surface runoff. Earth Surface Processes and Landforms 20 (3), pp. 207–218. External Links: ISSN 1096-9837, Link, Document Cited by: 1.
- Paleoenvironments and paleohydrology of the mojave and southern great basin deserts. Geological Society of America Special Paper 368, pp. 79–114. Cited by: 2.
- Hot deserts and arid shriblands: part a. Elsevier, New York. Cited by: 1.
- Optical dating of single and multiple grains of quartz from jinmium rock shelter, northern australia: part i, experimental design and statistical models. Archaeometry 41 (2), pp. 339–364. Cited by: 4.4.
- Varved sediments of lake yoa (ounianga kebir, chad) reveal progressive drying of the sahara during the last 6100 years. Sedimentology 60 (4), pp. 911–934. Cited by: 1.
- Dating desert pavements â first results from a challenging environmental archive. Quaternary Geochronology 30, Part B, pp. 342–349. Note: {LED14} Proceedings Cited by: 5.3.
- Vegetation dynamics during the last deglaciation, southeastern great basin, u.s.a.. Quaternary Research 33 (2), pp. 188–203. Cited by: 5.2.
- Late cenozoic landscape evolution on lava flow surfaces of the cima volcanic field, mojave desert, california.. Geological Society of America Bulletin 96 (12), pp. 1518–1529. Cited by: 1, 1, 3, 4.3, 5.4, 5.4.
- Cosmogenic 3he surface-exposure dating of stone pavements. implications for landscape evolution in deserts. Geology 23 (7), pp. 613–616. Cited by: 2.
- Late quaternary geology and paleohydrology of pluvial lake mojave, southern california. Special Paper of the Geological Society of America, Vol. 368. Cited by: 1, 2, 5.1, 5.4, 5.4.
- IntCal13 and marine13 radiocarbon age calibration curves 0-50,000 years cal bp. Radiocarbon 55 (4), pp. 1869–1887. Cited by: 2.
- Genetically meaningful decomposition of grain-size distributions. Sedimentary Geology 202 (3), pp. 409–424. Cited by: 3.1, 3.1.
- Devils hole, nevada, δ18o record extended to the mid-holocene. Quaternary Research 66 (2), pp. 202–212. Cited by: 1.
- An enhanced role for the tropical pacific on the humid pleistocene-holocene transition in southwestern north america. Quaternary Science Reviews 78, pp. 319–341. Cited by: 1.
- Infra-red stimulated luminescence ages from aeolian sand and alluvial fan deposits from the eastern mojave desert, california. Quaternary Science Reviews 13 (5-7), pp. 533–538. Cited by: 2.
- Late quaternary eolian dynamics, mojave desert, california. Special Paper of the Geological Society of America, Vol. 368. Cited by: 1, 2, 5.4.
- Low latitude dune fields. Encyclopedia of Quaternary Science, pp. 626–642. Cited by: 1.
- Holocene rock varnish microstratigraphy and its chronometric application in the drylands of western usa. Geomorphology 84 (1-2), pp. 1–21. Cited by: 1, 5.2, 5.4.
- Blind testing of rock varnish microstratigraphy as a chronometric indicator: results on late quaternary lava flows in the mojave desert, california. Geomorphology 53 (3-4), pp. 209–234. Cited by: 1, 5.4.
- Performance tests using the lexsyg luminescence reader. Geochronometria 41 (4), pp. 327–333. Cited by: 3.2.
- Luminescence dating of sand ramps in the eastern mojave desert. Geomorphology 17 (1-3 SPEC. ISS.), pp. 187–197. Cited by: 2.
- Middle and late pleistocene humid periods recorded in palaeolake deposits of the nafud desert, saudi arabia. Quaternary Science Reviews 70, pp. 109–123. Cited by: 1.
- [53] NCDC. Note: Available at http://www.ncdc.noaa.gov/oa/ncdc.htm (2014/09/29) Cited by: 2.
- Late quaternary arid/humid cycles in the mojave desert and western great basin of north america. Quaternary Science Reviews 21 (7), pp. 799–810. Cited by: 5.1.
- Desert pavements and associated rock varnish in the mojave desert: how old can they be?. Geology 29 (9), pp. 855–858. Cited by: 5.2.
- Cosmic ray contributions to dose rates for luminescence and esr dating: large depths and long-term time variations. Radiation Measurements 23 (2-3), pp. 497–500. Cited by: 3.2.
- A half-million-year record of paleoclimate from the lake manix core, mojave desert, california. Palaeogeography, Palaeoclimatology, Palaeoecology 365â366, pp. 11–37. Cited by: 1.
- Luminescence dating of quartz using an improved single-aliquot regenerative-dose protocol. Radiation Measurements 32 (1), pp. 57–73. Cited by: 3.2, 4.4.
- The single aliquot regenerative dose protocol: potential for improvements in reliability. Radiation Measurements 37 (4-5), pp. 377–381. Cited by: 3.2.
- Eolian landforms. Special Publication, pp. 447–520. Cited by: 1.
- Influence of hcl pretreatment and organo-mineral complexes on laser diffraction measurement of loess-paleosol-sequences. Catena 137, pp. 392–405. Cited by: 3.1.
- Physics and modelling of wind erosion. Springer. Cited by: 5.2.
- Temperate grasslands as a dust source: knowledge, uncertainties, and challenges. Aeolian Research 3 (3), pp. 271–293. Cited by: 5.2.
- Aeolian sediments on the north-eastern tibetan plateau. Quaternary Science Reviews 57, pp. 71–84. Cited by: 5.2.
- Alluvial sediment or playas: what is the dominant source of sand and silt in desert soil vesicular a horizons, southwest usa. Journal of Geophysical Research: Earth Surface 118 (1), pp. 257–275. External Links: ISSN 2169-9011, Link, Document Cited by: 5.1, 5.3, 6.
- [66] Luminescence: comprehensive luminescence dating data analysis. Note: Available at http://CRAN.R-project.org/package1/4Luminescence (2015/11/08) Cited by: 3.2.
- Regional response of alluvial fans to the pleistocene-holocene climatic transition, mojave desert, california. Special Paper of the Geological Society of America, Vol. 368. Cited by: 1, 2, 5.4.
- Grain size of fine-grained windblown sediment: a powerful proxy for process identification. Earth-Science Reviews 121, pp. 18–30. Cited by: 4, 4.2, 5.1.
- Loess-like and palaeosol sediments from lanzarote (canary islands/spain) - indicators of palaeoenvironmental change during the late quaternary. Palaeogeography, Palaeoclimatology, Palaeoecology 278 (1-4), pp. 71–87. Cited by: 1.
- A 300-kyr record of aridity and wind strength in southwestern africa: inferences from grain-size distributions of sediments on walvis ridge, se atlantic. Marine Geology 180 (1-4), pp. 221–233. Cited by: 3.1.
- Rates of soil development from four soil chronosequences in the southern great basin. Quaternary Research 35 (3 PART 1), pp. 383–399. Cited by: 1.
- End-member modeling of compositional data: numerical-statistical algorithms for solving the explicit mixing problem. Mathematical Geology 29 (4), pp. 503–549. Cited by: 3.1.
- Effect of vegetation coverage on aeolian dust accumulation in a semiarid steppe of northern china. Catena 87 (3), pp. 351–356. Cited by: 5.2.